
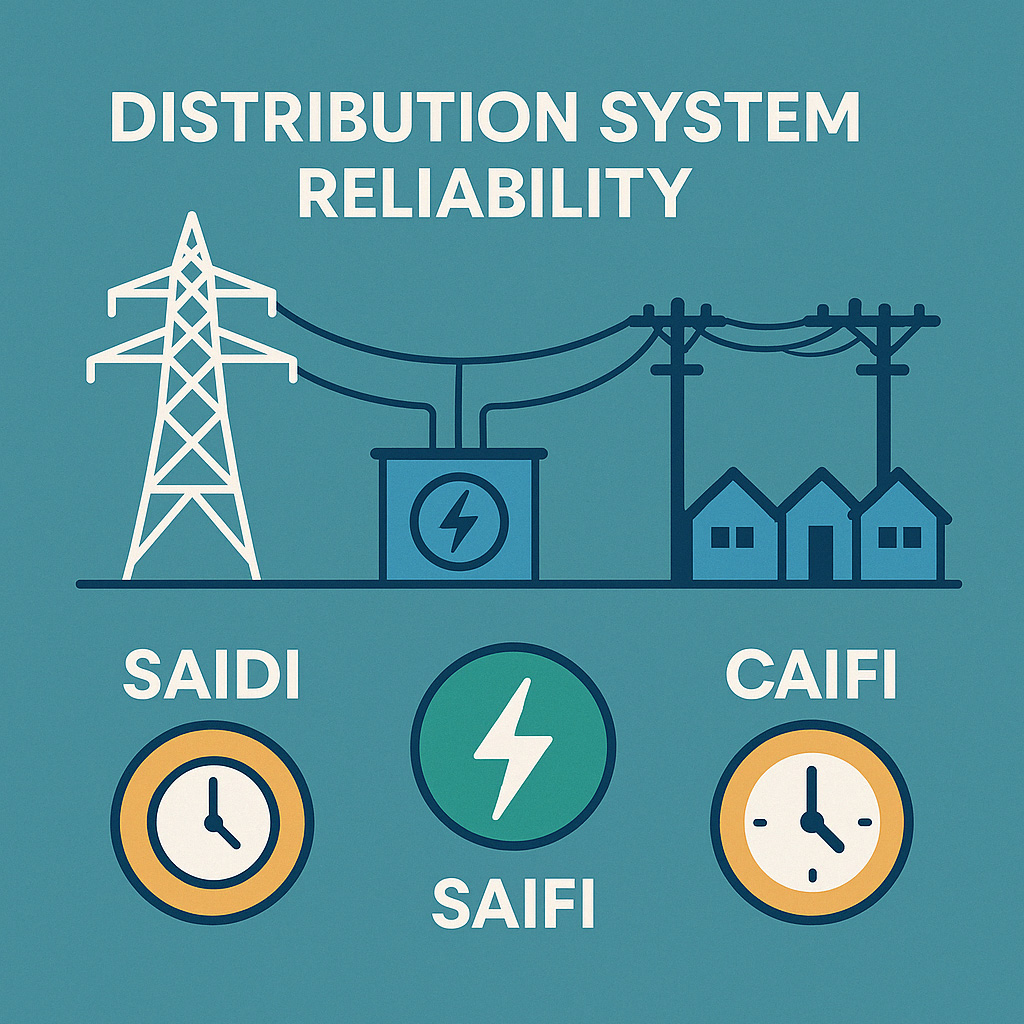
Electricity is an essential part of modern life, powering homes, businesses, and industries. A reliable electrical distribution system ensures continuous power supply with minimal interruptions. However, outages occur due to weather events, equipment failures, or operational issues. Measuring and improving power system reliability is key to maintaining a stable and efficient grid.
Key Takeaways: Distribution Reliability at a Glance
- Distribution system reliability measures how consistently utilities deliver electricity with minimal outages
- The four most common reliability metrics are SAIDI, SAIFI, CAIDI, and MAIFI
- Utilities use these metrics to guide infrastructure investments, maintenance programs, and regulatory reporting
- Technologies like reclosers, smart grids, undergrounding, and predictive analytics can improve reliability
- Combining weather and grid data enables utilities to predict storm-related outages and prioritize resilience investments
Standard IEEE 1366–2022 provides guidelines for defining and calculating reliability indices, helping utilities assess system performance and implement improvements. This blog post simplifies the concept of power system reliability, explains key reliability indices, discusses improvement strategies, and explores storm resiliency planning.
Why Is Electrical Grid Reliability Important?
Measuring power system reliability is essential for electric utilities because it provides valuable insights into the overall health of the electrical grid. Without proper reliability measurement, utilities would struggle to identify areas that need improvement. Reliability metrics help pinpoint weaknesses, allowing utilities to prioritize infrastructure upgrades and maintenance efforts.
Additionally, reliability measurement is essential for enhancing customer satisfaction. Frequent power outages can lead to frustration among consumers, especially in industries where continuous power is critical. Reliability data helps utilities address these concerns and ensure better service quality.
Regulatory requirements also make reliability measurement a necessity. Utility commissions monitor reliability indices to ensure service providers are meeting industry standards. Utilities must submit reports on system performance, and failing to meet benchmarks may lead to regulatory penalties or mandated corrective actions.
Finally, measuring reliability justifies investments in grid modernization. Whether it’s upgrading old transformers, deploying smart grid technologies, or undergrounding power lines, reliability metrics help utilities demonstrate the need for investment to stakeholders and regulatory bodies.
How do Utilities Measure Grid Reliability?
Reliability indices help quantify system performance. IEEE 1366–2022 defines several key indices that provide utilities with a standardized way to measure and compare reliability across different regions and time periods.
Reliability Metrics at a Glance
| Metric | Measures | Typical Unit | Goal |
|---|---|---|---|
| SAIDI (System Average Interruption Duration Index) | Average outage duration per customer | Minutes/year | Lower |
| SAIFI (System Average Interruption Frequency Index) | Average outage frequency per customer | Interruptions/year | Lower |
| CAIDI (Customer Average Interruption Duration Index) | Average restoration time per outage | Minutes | Lower |
| MAIFI (Momentary Average Interruption Frequency Index) | Frequency of momentary outages | Interruptions/year | Lower |
1. What is SAIDI?
SAIDI is a key reliability metric that measures the total duration of power outages experienced by an average customer over a given period, usually a year. It is expressed in minutes or hours. A lower SAIDI value indicates a more reliable system, as customers experience fewer and shorter outages. For example, if SAIDI is 120 minutes, it means the average customer experiences two hours of power outages annually. Utilities use SAIDI to evaluate how quickly they restore power after an outage and identify the effectiveness of their response strategies.
2. What is SAIFI?
SAIFI measures the average number of outages per customer per year. It is calculated by dividing the total number of customer interruptions by the total number of customers served. A lower SAIFI value means fewer outages, indicating a more stable power system. For example, if SAIFI is 1.5, it means the average customer experiences 1.5 outages per year. Utilities use SAIFI to track outage trends and determine whether certain areas require infrastructure improvements or preventive maintenance.
According to the U.S. Energy Information Administration (EIA), in 2024, the average SAIFI across U.S. utilities was approximately 1.521 interruptions per customer, including major event days (MEDs). When excluding MEDs, the average SAIFI was about 1.043 interruptions per customer.
This indicates that, on average, customers experienced between 1 to 1.5 power interruptions annually, depending on whether major events like severe weather were considered. In comparison, the IEEE Standard 1366–1998 reports a median SAIFI value of approximately 1.10 interruptions per customer for North American utilities.
What is a Major Event Day?
A Major Event Day (MED) in the context of power system reliability is a day when extreme conditions — like severe storms, natural disasters, or other extraordinary events — cause widespread and prolonged outages that are not typical of normal operating conditions.
Why Do Utilities Track MEDs?
Utilities track reliability metrics like SAIDI (System Average Interruption Duration Index) and SAIFI (System Average Interruption Frequency Index) to monitor performance. However, a single extreme event can significantly skew these numbers. To give a more accurate picture of normal reliability, utilities often report two sets of reliability metrics:
- Including MEDs (shows total impact, including extreme events)
- Excluding MEDs (shows typical reliability under normal conditions)
These metrics are essential for utilities to assess and improve the reliability of their power distribution systems.
3. What is CAIDI?
CAIDI represents the average duration of an outage experienced by a customer once an outage occurs. It is calculated by dividing SAIDI by SAIFI. This index helps utilities understand how long it takes, on average, to restore power to customers. A lower CAIDI value means faster restoration times. For example, if CAIDI is 80 minutes, it indicates that when customers experience an outage, it takes an average of 80 minutes for power to be restored. Utilities use CAIDI to assess the efficiency of their repair crews and outage management systems.
4. What is MAIFI?
MAIFI measures the frequency of short-duration interruptions, typically those lasting less than five minutes. Momentary outages are often caused by transient faults, such as tree branches touching power lines or lightning strikes. These brief outages can significantly impact industrial and commercial customers who rely on uninterrupted power for their operations. Utilities use MAIFI to analyze the impact of momentary interruptions and implement solutions such as installing reclosers and improving fault detection technologies.
How Utilities Improve Distribution System Reliability
Several strategies can enhance distribution system reliability and reduce the frequency and duration of power outages.
1. Reclosers and Automated Fault Isolation
Reclosers are automated devices that detect faults on the power line and temporarily interrupt power. They attempt to restore power quickly after transient faults, such as a tree branch momentarily touching a line. If the fault is temporary, the recloser prevents a prolonged outage, improving SAIDI and SAIFI. Utilities can strategically place reclosers to minimize the impact of faults and improve system resiliency.
2. Underground Power Lines and Grid Hardening
Overhead power lines are highly susceptible to weather-related damage, including high winds, falling trees, and ice accumulation. Converting overhead lines to underground lines eliminates these risks, significantly improving reliability. While undergrounding is costly, it is an effective long-term solution for reducing outages in storm-prone areas. Utilities must evaluate the cost-benefit analysis to determine which areas would benefit the most from undergrounding efforts. Cost benefit analysis may include comparison between capital investment cost vs their potential savings on cost due to outages.
3. Replacing Traditional Fuses with Trip Savers
Traditional fuses permanently disconnect power after a fault, requiring a technician to replace the fuse before power can be restored. Trip savers, on the other hand, automatically attempt to reclose the circuit after a temporary fault, reducing unnecessary outages. By replacing fuses with trip savers, utilities can reduce outage durations and improve system reliability, particularly in areas where transient faults are common.
4. Smart Grid Technologies and Real-Time Monitoring
Smart grid technologies use advanced sensors, real-time monitoring and observability, and automation to improve power system reliability. Smart meters and automated switching devices help utilities detect faults quickly, isolate affected areas, and restore power efficiently. By leveraging data analytics, utilities can predict and prevent potential failures, reducing outages and improving customer satisfaction.
5. Predictive Maintenance and Asset Management
Regular maintenance of power lines, transformers, and substations helps prevent unexpected failures. Utilities conduct inspections using drones, thermal imaging, and predictive maintenance techniques to identify weak points in the system. Proactive maintenance reduces the likelihood of sudden breakdowns and enhances system reliability.
How Utilities Predict Storm-Related Outages
To improve storm resiliency, utilities must use data-driven strategies to predict potential storm-related damages and prioritize investments in grid hardening.
1. Required Data
To predict storm-related damages, utilities need two main types of data:
- Electrical Data: Historical outage records, SAIDI/SAIFI trends, asset condition data, grid topology, and equipment failure rates.
- Weather Data: Historical storm paths, wind speeds, precipitation levels, lightning strikes, and satellite imagery.
2. Data Collection Methods
- Smart meters and sensors collect real-time outage and load data.
- Weather stations and meteorological agencies provide storm tracking data.
- Drones and remote sensing technology assess infrastructure and terrain conditions.
- AI models analyze historical and real-time data for predictive analytics.
3. Using Data for Decision Making
By combining electrical and weather data, utilities can:
- Identify high-risk areas for infrastructure reinforcement.
- Prioritize undergrounding projects based on past storm impact.
- Optimize maintenance schedules to prepare for extreme weather.
- Use AI-based simulations to predict grid failures and allocate resources efficiently.
This data-driven approach helps utilities justify investments in storm resiliency projects, improving reliability and minimizing customer impact during extreme weather events.
Four Steps to Predict Storm-Related Grid Damage
Step 1: Collect Asset Data
- Asset age
- Equipment type
- Maintenance history
Step 2: Gather Weather Data
- Wind speed
- Rainfall
- Lightning
- Ice accumulation
Step 3: Model Failure Risk
- Historical outage correlations
- Failure probability models
- AI-based forecasting
Step 4: Prioritize Investments
- Undergrounding
- Vegetation management
- Pole replacement
- Additional reclosers
Building a More Reliable and Resilient Distribution Grid
Modern utility reliability programs increasingly depend on data engineering, cloud platforms, advanced analytics, and AI. By integrating outage history, asset data, weather intelligence, and operational systems into a unified data platform, utilities can move beyond reporting reliability metrics to predict outages, optimize investments, and improve grid resilience.
Frequently Asked Questions Related to this Post
What is a good SAIDI value?
A lower SAIDI indicates a more reliable electrical distribution system. Acceptable values vary by region, utility type, and weather conditions.
What is the difference between SAIDI and SAIFI?
SAIDI measures outage duration, while SAIFI measures outage frequency.
Why is CAIDI important?
CAIDI measures restoration efficiency by indicating how quickly utilities restore power after outages.