
Modern power systems engineering sits at the intersection of unprecedented data availability and increasing operational complexity. Field devices, wide‑area measurement systems, and advanced metering infrastructures continuously stream vast quantities of real‑time information. At the same time, engineers increasingly rely on high‑fidelity simulation models that mirror real‑world grid behavior with remarkable granularity. These detailed models, capable of capturing transient dynamics, protection interactions, and evolving operating conditions, generate their own flood of outputs, often producing more data than any human can reasonably interpret unaided.
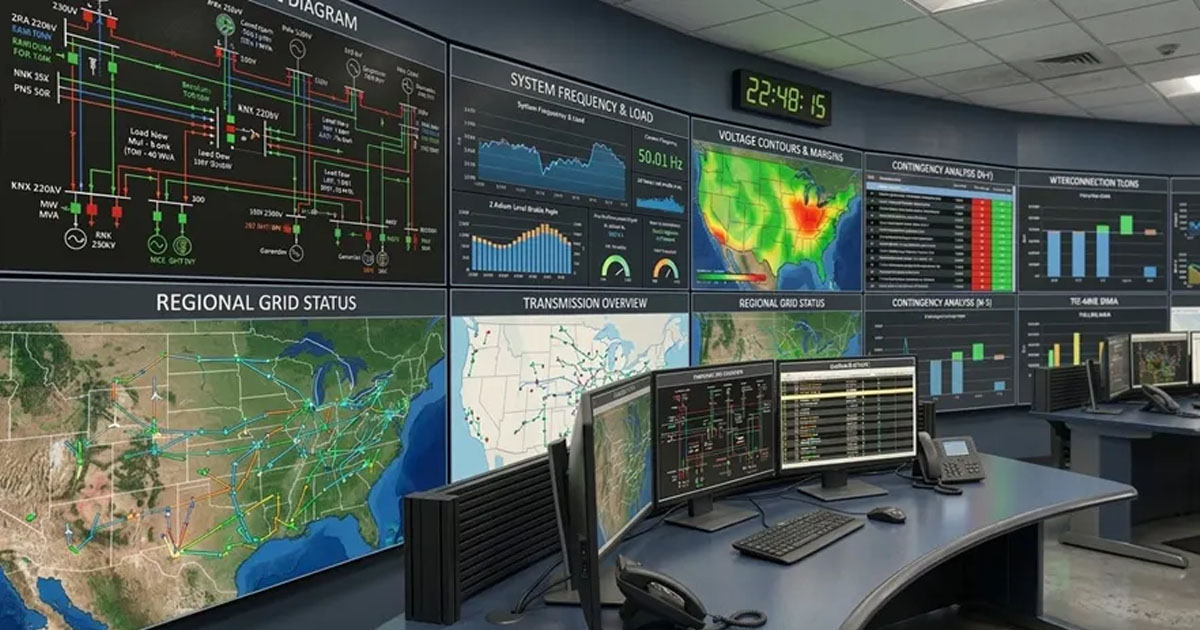
In this environment, the challenge is no longer obtaining data but transforming it into clarity. Effective decision‑making depends on the ability to distill millions of data points into patterns, trends, and warnings that can be understood briefly. This is where graphical aids become indispensable. Thoughtfully designed visualizations, whether they take the form of dynamic dashboards, network diagrams, heat maps, or time‑series analytics, serve as cognitive bridges between raw information and actionable insight. They help engineers navigate complexity, identify emerging risks, and communicate system conditions with precision and speed.
As power systems evolve toward greater digitalization and interconnectivity, the role of visualization grows ever more central. In an age defined by data overload, graphical tools are not merely conveniences; they are essential instruments for unlocking understanding and enabling informed, confident decisions.
In this blog post, I will introduce some emerging trends shaping how power engineers convert massive, often unwieldy datasets into meaningful, decision‑ready information for power system analysis and simulation. We’ll look at how modern visualization techniques, applied to both real‑world measurements and the increasingly detailed simulation models that mirror field conditions, are redefining the way planners and operators understand system behavior.
Visualizing specialized data
In electrical engineering, as in many technical disciplines, there is no single, universal study capable of fully evaluating or planning the state of a system under observation. In the context of power systems, that system is the electric grid, and its analysis requires a diverse set of methodologies tailored to different objectives. Depending on the focus (transmission or distribution), the scope (technical, economic, or the increasingly intertwined techno‑economic perspective), the study type (steady‑state, quasi‑static time series, dynamic behavior, or electromagnetic transients), and the geographical or operational boundaries of the assessment, engineers must select from a wide spectrum of specialized studies. Each provides a unique lens on system behavior, and together they form the analytical foundation needed to understand, plan, and operate modern grids.
Given this wide spectrum of study types, the volume and nature of the data produced can be broadly grouped into three categories: static data, low‑resolution time‑driven data, and high‑resolution time‑driven data. Each category reflects not only a different temporal granularity but also a different scale of data generation, computational burden, and analytical purpose. The amount of data produced within each block depends on several factors, such as model detail, simulation duration, sampling rate, and the specific electrical phenomena under investigation.

Static data graphs
Static data graphs provide a snapshot of the system’s state at a specific moment in time. The size of the dataset typically depends on the number of measurements collected for the analysis, which often span the entire infrastructure represented in the circuit model. Heatmaps are one of the most common visualization methods for this type of data, illustrating parameters such as voltage levels, power flows, system violations, and unintended islanding, among others.
For instance, a voltage heatmap uses an interpolated color scale to visualize the distribution of voltage levels across the circuit model, whether displayed as an electrical schematic or overlaid on a geographical map. This type of visualization highlights the overall system state and helps engineers quickly identify abnormal operating conditions or unexpected spatial patterns.
Similarly, bar graphs representing the harmonic spectrum allow engineers to assess the presence and magnitude of harmonic distortion. This information is essential for designing mitigation strategies, such as filters that address resonance conditions introduced by newly connected grid assets.
Other static visualizations also play a crucial role in system analysis. Current‑flow diagrams can highlight overloaded feeders or phase imbalances. Thermal maps help pinpoint hotspots in transformers or cables before they escalate into failures. Scatter plots comparing power factors and load can expose operational inefficiencies that might otherwise go unnoticed. Topology‑based views, such as connectivity diagrams, support the detection of unintended islanding and help verify correct switching configurations. Intensity graphs are equally valuable when illustrating the impact of a specific technology or operational decision, particularly when addressing issues triggered by a single event, such as peak‑shaving strategies aimed at extending asset lifespan.

Together, these static data graphs provide engineers with a comprehensive toolkit for diagnosing system behavior, validating model assumptions, and supporting informed decision-making across the entire electrical network.
Low-resolution time-driven data graphs
Low-resolution time-driven data graphs are designed to represent time‑based behavior over long periods. Their time resolution typically ranges from hours to minutes, and in some cases, seconds. The simulations behind them, commonly referred to as Quasi‑Static Time Series (QSTS) simulations, are used to capture slow, time‑dependent behavior in distribution systems, particularly where Distributed Energy Resources (DER), load variability, and control device actions interact. They are essential when traditional snapshot power‑flow studies fail to reveal cumulative or time‑coupled impacts such as voltage regulator wear, inverter control behavior, or duration‑based voltage violations.
QSTS simulations model time‑varying but quasi‑steady behavior: each time step solves a steady‑state power flow, while the sequence of steps captures system dynamics over time. These simulations also respect the principle of causality, meaning the present state of a controller or device depends on its previous states and on the system’s prior operating conditions.
Because QSTS can recreate realistic operating conditions and device interactions, it is a powerful tool for distribution planning studies. In practice, the time resolution is often around 5 minutes, aligning with the data granularity typically available from Distribution Management Systems (DMS) or Energy Management Systems (EMS).
Low‑resolution, time‑driven data visualizations typically rely on at least two dimensions, with time being one of them. Because system‑wide values must be condensed to reveal overall behavior and temporal trends, summary‑style plots from other domains, such as box‑and‑whisker charts or wrapping‑curve techniques, have become valuable tools for informing engineers and decision‑makers about the state of the power system at a given moment. These visualizations help highlight potential solutions and identify projects that may need to be implemented.

However, when studies span long time periods, data granularity can become difficult to interpret. In such cases, additional dimensions are often introduced to reduce complexity. A good example is the demand‑interval graph, a three‑dimensional visualization that allows engineers to observe demand patterns across multiple timescales within a single plot. Similarly, multi‑series or overlay charts combine curves from different variables over the same time window, enabling engineers to visually correlate behaviors and detect issues through direct inspection.
High-resolution time-driven data graphs
These graphs are designed to represent time‑based data with very high temporal resolution. Such data is typically produced by advanced simulation methods, including electromechanical dynamic studies (which rely on algebraic–differential equations) and electromagnetic transient (EMT) simulations, both of which require detailed equipment models to operate accurately.
These studies, commonly used for interconnection assessments, equipment design, stability and similar analyses, generate large volumes of data within very short time windows. With time steps ranging from milliseconds down to microseconds, even a simulation lasting only a few seconds can produce an extensive dataset.
The graphs for representing this data are also detailed, graphically revealing details about the data represented, where all the variables matter. Frequency, amplitude, phase angle, and variability are some of the values that need to be represented when performing high-resolution studies in power systems, since, depending on the consistency and integrity of the voltage and current signals, other values derived from them will then reveal critical information to engineers to make the right decision.
In many cases, depending on the simulation domain, it becomes necessary to translate or project the results into an equivalent representation in another domain. For example, a dynamic study performed in the frequency domain can be projected into the time domain by converting phasor‑based quantities, such as magnitude and phase angle, into their corresponding sinusoidal waveforms. These projections are often used to extend the applicability of certain simulation techniques, providing a reasonable approximation while reducing computational effort compared with running a full simulation in the target domain.

However, despite the efficiency of these projection methods, high‑fidelity simulations remain essential in situations where the study requires detailed, domain‑specific accuracy. In such cases, only a full simulation in the appropriate domain can capture the nuances needed to obtain a reliable answer.
Hybrid graphs
A final category of visualizations combines multiple graph types to extend the use of information beyond simply displaying results or trends. These hybrid visual tools are often used to present proof‑of‑concept demonstrations or to convey system behavior through dynamic, story‑driven animations. For example, consider the static voltage‑level map introduced in the section on static data graphs. When this map is paired with a quasi‑static time‑series (QSTS) simulation running at a slow cadence, such as solving the circuit model every second and refreshing the voltage map accordingly, it becomes an animated visualization that reveals the system state at each simulation step. The chosen time resolution directly influences the smoothness and interpretability of the animation, turning raw data into a compelling narrative for educational purposes or early‑stage concept validation.

These techniques become even more powerful when extended to real‑time simulation environments. Real‑time digital simulators (RTDS) or hardware‑in‑the‑loop (HIL) platforms can stream high‑resolution data continuously, allowing visualizations to update at the same rate as the physical or simulated system. In this context, animated graphs are not merely illustrative; they become operational tools. Engineers can observe system responses as they occur, validate controller behavior, test protection schemes, or demonstrate the impact of switching actions and disturbances with immediate visual feedback. The combination of real‑time data and dynamic visualization transforms the graphs into an interactive medium that supports training, experimentation, and rapid decision‑making.
Selecting the Most Effective Representation for Your Data
As previously noted in electrical engineering, and particularly in power systems analysis, no single study can fully capture or predict the behavior of the grid. Different objectives demand different analytical approaches. Depending on whether the focus is transmission or distribution, whether the scope is technical, economic, or techno‑economic, and whether the study type involve steady state behavior, QSTS, dynamics, or electromagnetic transients, engineers must draw from a broad suite of specialized studies. Each method provides a unique perspective, and together they form the comprehensive analytical framework required to design, operate, and plan modern electric grids.
Throughout this discussion, we have explored a variety of tools that transform large volumes of data into meaningful representations, visualizations that help engineers and algorithms identify trends, detect system states, and pinpoint areas requiring technical intervention in both the short and long term. These insights empower decision makers to invest wisely, ensuring that power systems remain reliable, safe, resilient, and affordable for customers worldwide.
The need to convert massive datasets into actionable information is not unique to any single utility. It is a shared challenge across the entire industry as organizations expand their data collection, refine their digital twins, and strive to build more robust and adaptable grids. As demand grows and systems become increasingly complex, the ability to distill big data into clear, decision‑ready intelligence will remain essential for shaping the future of the electric power sector.
At New Math Data, we are continually pushing this transformation forward. By turning raw data into clear, actionable information, we empower our customers to make smarter decisions and accelerate their business goals. Our tools and deliverables are built to provide clarity, insight, and confidence, helping organizations navigate complexity and move decisively toward the future.