


Data Quality Monitoring in AWS SageMaker
First things first, what is data quality monitoring?
Data quality monitoring for machine learning can generally be thought of from two perspectives.
One perspective is that of traditional data-engineering. This type of monitoring is concerned with the “physical” characteristics of the data and ensuring they are what you expect them to be. It involves criteria such a data-types, missing values, etc.
The main objectives with this type are ensuring downstream processes (usually our model) can handle the data inputs and enforcing constraints on the data schema to prevent data-type and column matching errors during inference.
This is the type of data quality we think of with regards to data pipelines.
The other perspective is data quality from a statistical perspective. Here, the concern is the differences in the underlying statistical distributions between two datasets.
These differences in statistical properties are what is known as “data drift”. Here we are interested in if the data has “drifted” away from what your model was initially trained on.
Differences in distributions can often arise because of differences between sub-populations within our larger population of interest. Problems can arise here when we train mostly on data from certain sub-populations but our model performs inference on the others.
To illustrate this concept let us think about apples. You can approach this by thinking about all apples as a whole, but it is probably better to consider apples at the granularity of apple variety because certain types of apples tend to be different from others.
Imagine training a model solely on sour apples, but at our endpoint, we use every variety except sour apples. We might expect worse performance than if we had trained our model on different data. With data drift we should be able to detect that the data hitting our endpoint is slightly different than what we trained on and make a correction.
Differences in statistical distributions can also arise because of changes in the population itself over time.
A good example of this might be changes in a user-base. Facebook was very popular amongst younger individuals when it launched and since then its user-base has gradually skewed older. If you are using models trained on the wrong demographic you can also get worse performance – behaviors and interests can change with age.
Being informed and able to account for these differences can help provide teams context they need for their mental models of the problem-space and allow them to create more performant machine-learning models.
SageMaker Data Quality monitoring
SageMaker data quality monitoring provides a way to monitor both types of data quality on real-time endpoints and batch transform jobs.
The key components to the setup are:
- Monitoring jobs use baseline data – typically the data on which your model was initially trained – to generate associated constraints and statistics.
- Endpoints and batch transforms allow for data capture, allowing you to collect the data that your models are seeing in production.
- Captured data is then compared to your baseline data to check for for violations. Reports are generated and CloudWatch metrics and alarms can be used for further visibility and alerting.
Monitoring can then be setup to run in accordance with a cron schedule or, alternatively, run on an ad-hoc basis.
Important: In order for monitoring to work, data capture needs to be enabled for you endpoint or batch transform.
Setting up the data quality baselines
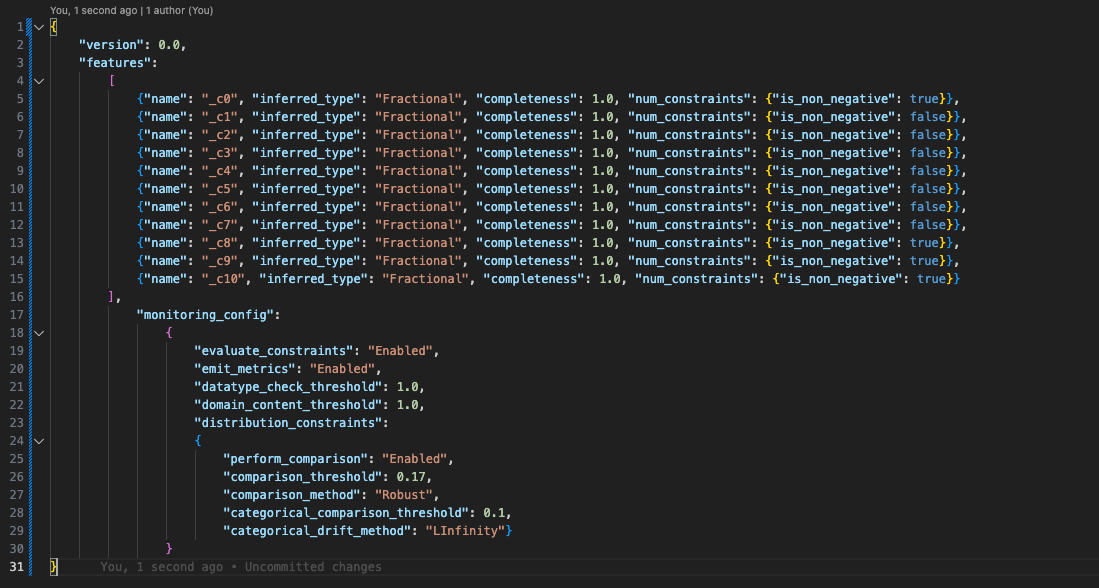
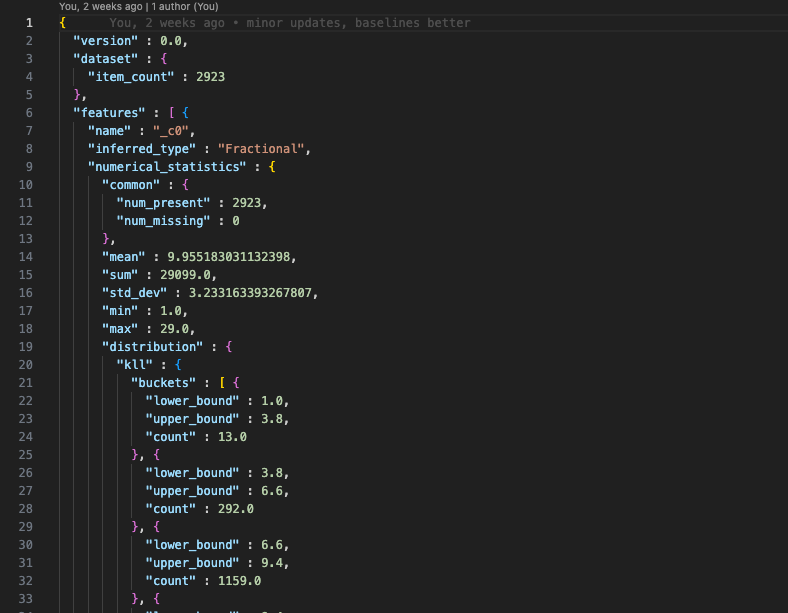
Baselines, as the name suggest, provide a reference against which to compare the data that your model actually sees. A good baseline dataset can be the data your model is trained on. Baselining generates a constraints.json and a statistics.json file to be used for later comparison. We briefly cover the structure of those files further down this article.
Perhaps most natural place to generate constraints and statistics for baseline data is within a SageMaker Pipeline.
This is because you are usually training and evaluating your model in the pipeline already. You can simply add a QualityCheckStep to your pipeline that can output the results of your data-quality baselining.
There are some advantages to doing it this way.
- Sagemaker pipelines are very good at providing metadata for each step allowing you to track inputs and outputs for a given execution – staying organized is such a key part of machine-learning workflows.
- Since the result of “data drift” might be retraining model you can kill two birds with one stone by executing a pipeline with new training data – both creating a new model version and establishing new baseline at the same time.
- We can evaluate the change in model performance in same pipeline as you are training and creating baselines. Hopefully the performance increases once the model is trained on the appropriate data.
The other place you can opt to generate constraints and statistics for baseline data is when you are defining the model monitor itself using the SageMaker Python SDK.
Here is an example of what that looks like:
from sagemaker.model_monitor import DefaultModelMonitor
from sagemaker.model_monitor.dataset_format import DataSetFormat

train_data = "s3://my-model-s3-bucket/datasets/train"
baseline_reports_loc = "s3://my-model-monitoring/data-quality-reports"

data_quality_monitor = DefaultModelMonitor(
    role=role, instance_count=1, instance_type="ml.m5.large", volume_size_in_gb=1, max_runtime_in_seconds=600
)

# Our pipeline has no baseline so we need to create one
data_quality_monitor.suggest_baseline(
    baseline_dataset=train_data,
    dataset_format=DatasetFormat.csv(header=True),
    output_s3_uri=baseline_reports_loc,
    wait=True,
)

# Use the data_quality_monitor instance to schedule our monitoring job
schedule = data_quality_monitor.create_monitoring_schedule(
   ...
)
The advantage to this is you can use the data_quality_monitor instance to both suggest a baseline and then schedule the job.
Here are what the constraints.json and statistics.json files generated on the baseline data might look like:
Scheduling your monitoring job
Once we have used baseline data to generate our constraints and statistics we can define a DefaultModelMonitor using the SageMaker Python SDK, which allows us to configure the monitoring job and create/update monitoring schedules
This is the same Python class we used in our code snippet to suggest a baseline.
Instantiating the class should look familiar to SageMaker users
from sagemaker.model_monitor import DefaultModelMonitor

data_quality_monitor = DefaultModelMonitor(
    role=role, instance_count=1, instance_type="ml.m5.large", volume_size_in_gb=1, max_runtime_in_seconds=600
)
This is because the DefaultModelMonitor is going to define a processing job that will be run when suggesting baselines or monitoring a model.
This processing job uses a pre-built container provided by AWS based on Spark 3.3.0 and Deequ 2.0.2.
Once we have instantiated this class we can then define our schedule.
The first important thing to note when defining this schedule is whether or not you are going to monitor a real-time endpoint or a batch transform job.
Real-time Endpoints
When defining a schedule for a real-time endpoint the main piece of information the monitoring schedule needs is the Endpoint Name. You cannot use an ARN here and so the monitoring schedule needs to be defined in the same account as the endpoint.
Here is a snippet showing how that might look for an ongoing daily scheduled monitoring job:
from sagemaker.model_monitor import CronExpressionGenerator, EndpointInput

ENDPOINT_NAME = "My-sagemaker-realtime-endpoint"
endpoint_input = EndpointInput(endpoint_name=ENDPOINT_NAME, destination="/opt/ml/processing/input/endpoint")

schedule = data_quality_monitor.create_monitoring_schedule(
    monitor_schedule_name="My-realtime-monitoring-schedule",
    output_s3_uri=f"s3://my-monitoring-bucket/{ENDPOINT_NAME}",
    schedule_cron_expression=CronExpressionGenerator.daily(),
    statistics=f"s3://my-data-quality-bucket/{ENDPOINT_NAME}/statistics.json",
    constraints=f"s3://my-data-quality-bucket/{ENDPOINT_NAME}/constraints.json",
    enable_cloudwatch_metrics=True,
    endpoint_input=endpoint_input
)
One great thing about the endpoints is that there is UI support for the monitoring jobs. As far as I can tell this is not the case for batch transforms.
In the SageMaker service console if you go into Governance -> Model Dashboard you can see models which have monitoring schedules defined for them.
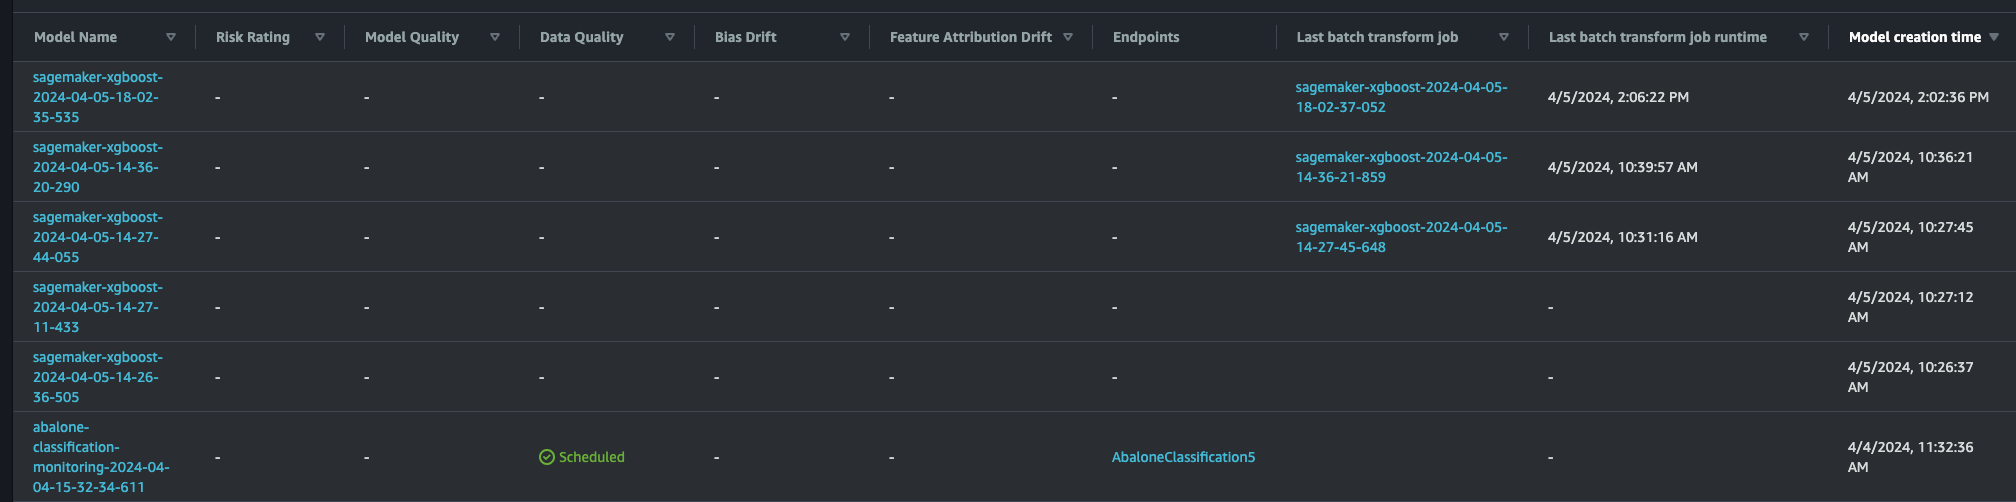
You can click on the model name and then follow the buttons to see all the monitoring executions and resulting reports.
Batch Transforms
Batch transforms are slightly different in what you specify when you create a monitoring schedule. Instead of specifying a batch transform job name, you specify the s3 data capture location of the batch transform in question.
Note: This difference probably has to do with differences in how real-time endpoints and batch transforms capture data (I will expand upon how the two processes differ in an Endnote at articles conclusion).
This allows you to define monitoring schedules for batch transform jobs in a different account (as long as the role attached to the job has the appropriate cross-account access).
Here is what a batch transform scheduling job defined on an ad-hoc basis (instead of a schedule) looks like:
from sagemaker.model_monitoring import CronExpressionGenerator, BatchTransformInput
from sagemaker.model_monitor.dataset_format import MonitoringDatasetFormat

batch_transform_name = "my-batch-transform"
data_capture_loc = f"s3://my-batch-transform-data-capture-bucket/{batch_transform_name}"

# We pass in a data capture location instead of a name here
# the monitoring job will look for captured data in this location
batch_transform_input = BatchTransformInput(
  data_captured_destination_s3_uri=data_capture_loc,
  destination="/opt/ml/processing/input",
  dataset_format=MonitoringDatasetFormat.csv(header=True)
)

schedule = data_quality_monitor.create_monitoring_schedule(
    monitor_schedule_name="my-batch-transform-monitoring-schedule",
    output_s3_uri=f"s3://my-batch-transform-monitoring-reports/{batch_transform_name}",
    schedule_cron_expression=CronExpressionGenerator.now(),
    statistics=f"s3://my-batch-transform-baslines/{batch_transform_name}/statistics.json",
    constraints=f"s3://my-batch-transform-baslines/{batch_transform_name}/constraints.json",
    enable_cloudwatch_metrics=True,
    batch_transform_input=batch_transform_input,
    data_analysis_start_time="-PT2H",
    data_analysis_end_time="PT0H",
)
You can see that we use CronExpressionGenerator.now() in conjunction with a data_analysis_start_time and data_analysis_end_time and this is because this is the ad-hoc version of a monitoring schedule. It will only run once and it will look at the last 2 hours of data captured only.
Results
When the scheduled monitoring job runs successfully it should generate a constraint_violations.json file at the output location you specified.
This will contain any violations that occurred. Here is an example of violation that occurred on my target feature:
{
  "violations": [
    {
      "feature_name": "_c0",
      "constraint_check_type": "baseline_drift_check",
      "description": "Baseline drift distance: 0.16599861545343375 exceeds threshold: 0.1"
    }
  ]
}
Basically, this violation says the distributions of my actual labels and my predicted labels exceeded the drift distance threshold of 1.0 (the model was not very good).
Note: distribution distances are calculated using the Kolmogorov-Smirnov test
Data capture differences between endpoints and batch transforms
I mentioned that the difference in how you define scheduling jobs for endpoints and batch transforms is likely due to different data capture methods.
I will briefly explain what I meant by that.
When you configure data capture on a real-time endpoint you specify an output location in s3. Assuming that you have specified 100% capture, then for every payload that hits the endpoint you will capture all the data from the request.
Lets say we have an endpoint named: MyEndpoint and we specify that data for this endpoint should be captured at s3://my-endpoint-capture-bucket
When we deploy this endpoint and data is captured it create a json line file like so:
s3://my-endpoint-capture-bucket/MyEndpoint/AllTraffic/YYYY/MM/DD/HH/.jsonl
This file will contain data that looks like this:
{
  "captureData": {
    "endpointInput": {
      "observedContentType": "text/csv",
      "mode": "INPUT",
      "data": "-1.4489858478494209,-1.4903180070669182,-1.3035324669760926,-1.3353083447341376,-1.3015779184806568,-1.3329571521045311,-1.284833620945126,0.0,1.0,0.0",
      "encoding": "CSV"
    },
    "endpointOutput": {
      "observedContentType": "text/csv; charset=utf-8",
      "mode": "OUTPUT",
      "data": "7.226283073425293",
      "encoding": "CSV"
    }
  },
  "eventMetadata": {
    "eventId": "3eb448ef-14ac-42a7-8fb9-485f3e017caf",
    "inferenceTime": "2024-03-27T17:57:34Z"
  },
  "eventVersion": "0"
}
{
  "captureData": {
    "endpointInput": {
      "observedContentType": "text/csv",
      "mode": "INPUT",
      "data": "0.0083936766622577,0.1725193283071389,1.2071048956425745,0.0882218360855744,0.4646940371048808,-0.0738460267491236,-0.2861700019134656,0.0,0.0,1.0",
      "encoding": "CSV"
    },
    "endpointOutput": {
      "observedContentType": "text/csv; charset=utf-8",
      "mode": "OUTPUT",
      "data": "9.85294246673584",
      "encoding": "CSV"
    }
  },
  "eventMetadata": {
    "eventId": "62bfe866-edd8-4736-a823-af990a617902",
    "inferenceTime": "2024-03-27T17:57:34Z"
  },
  "eventVersion": "0"
}
You can see that is directly capturing the inputs and outputs for each datapoint sent in a payload.
Batch transforms work differently.
Because batch transforms are often used on large dataset and are well-defined jobs we can prevent the copying of a lot of data. The way we do this is to use manifests at the data capture location that point to the input and output of the batch transform job.
Lets assume our data capture location for our batch transform is s3://my-transform-capture-bucket
What you are going to get is a split
inputs: s3://my-transform-capture-bucket/input/YYYY/MM/DD/HH/.json
outputs: s3://my-transform-capture-bucket/output/YYYY/MM/DD/HH/.json
These json files are manifests and will point at the actual input and output data that was used in the transform.
Below is an example of the input manifest for a particular hour:
[
    {
      "prefix": "s3://my-batch-transform-data/transform-input"
    },
    "/input_000.csv"
]
This points back to the input data location in s3 that was used in the batch transform, so you can reference the exact data and didn’t need to recreate a copy of it.
I assume this is the reason for the differences between the information you need to give to a monitoring schedule for endpoints and batch transforms.
The batch transform setup allows for some cross-account flexibility, but the endpoints have UI support and therefore better visibility and user-friendliness. In the end the choice will most likely be determined by your unique requirements – is an endpoint or batch transform more suited to your use case.
Conclusion
That is a quick overview of SageMaker Data Quality Monitoring, how it works, and why you might want to use it.
There are other aspects of SageMaker Model Monitoring that we did not touch on in this article, but might be of interest. These include monitoring for bias and model quality. Additionally, there is also a model explainability component that uses Shapley values to do feature attribution.